.png)
NHS CHC Statistics - Q2 2025/2026
- Joanne Walmsley
- Feb 6
- 2 min read

Updated: Feb 7
Introduction
The NHS publishes quarterly statistics on Continuing Healthcare (CHC) activity and outcomes.
This update looks at the latest figures for July to September 2025 and what they show at a national and regional level.
These statistics are based on official NHS data and are updated each quarter.
National trend

The national standard CHC eligibility rate has shown a gradual downward trend over the past 18 months.
Earlier in the period, the eligibility rate was around 22–23%.
In the latest quarter, it is closer to 19%.
This means that, nationally, around 1 in 5 people assessed through the standard CHC route are found eligible.
Regional variation

Eligibility rates continue to vary across regions.
In the latest quarter, regional rates ranged from around 13% to 26%, depending on where the assessment took place.
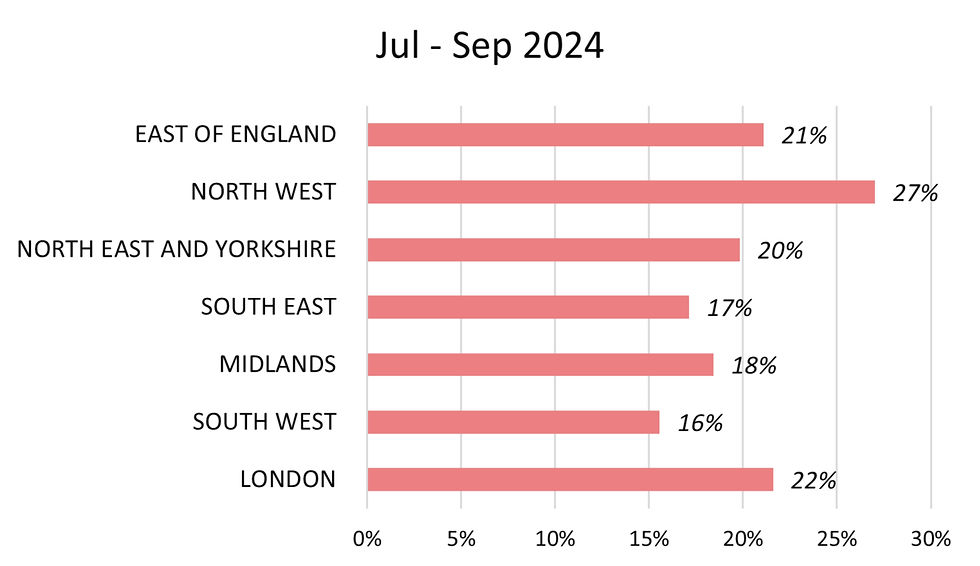
Comparing the same quarter year-on-year shows that some regions have experienced noticeable changes in their eligibility rates.
Variation at ICB level
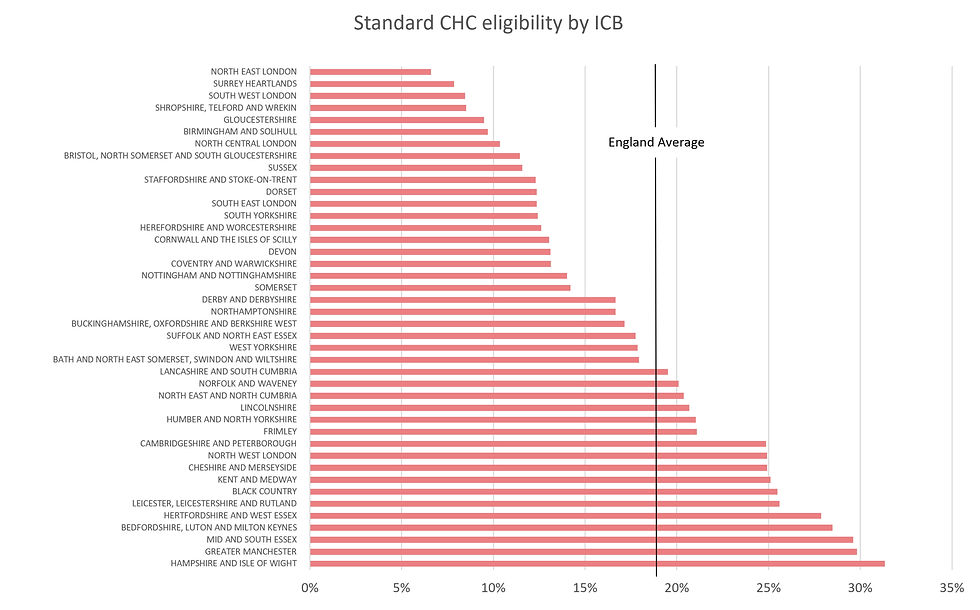
Note: The England average is based on the total number of people assessed across the country, not the midpoint of the ICBs, so it is normal for many areas to appear below the national average.
When looking at individual Integrated Care Boards (ICBs), the variation is even greater.
In the latest quarter, standard CHC eligibility ranged from around 8% to over 30% depending on the ICB.
The England average was approximately 19%.
This means that eligibility rates in some areas are three to four times higher than in others.
Local review outcomes

The statistics also show how often decisions change at local review stage.
These outcomes vary by region.
In the latest quarter, the proportion of decisions changed at local resolution ranged from around 17% to 57% depending on the region.
However, these figures:
Are based on relatively small numbers
Vary by case type
Cannot predict the outcome of an individual review
What these statistics mean
CHC statistics show both regional variation and changes over time.
They do not explain the reasons behind individual decisions or local differences.
Each CHC assessment is based on a person’s specific needs and circumstances.
What the data does highlight is the importance of:
Preparation
Clear evidence
Understanding how the framework is applied
In many areas of life, preparation makes a difference.
We learn the rules before a driving test and we revise before an exam.
The statistics show variation between areas, as well as changes in national eligibility rates over time, but preparation and an understanding of the framework can help families approach assessments with more clarity and structure.
If you’re looking for practical support with preparation, we’ve created a small set of tools designed to help families organise evidence, understand the framework language, and prepare for assessments more confidently.

Source
NHS England Continuing Healthcare quarterly statistics
Comments